Back
Back

Scenario modelling has formed part of Peregrine Wealth’s investment philosophy for over two decades, and it enables us to better understand potential market outcomes and construct stronger portfolios. The Peregrine Wealth Investment Management team has a core or “High Conviction” scenario based on a three-year view, which is expressed as macroeconomic and market assumptions, including economic growth, inflation, interest rates, price-earnings multiples, and credit spreads, to list a few. Based on these assumptions, our asset valuation models produce expected returns for various asset classes. This section is used to summarise our High Conviction view and the resulting asset signals.
High conviction scenario: medium-term expected returns
Our High Conviction scenario continues to reflect an environment in which the global economy grows close to its potential over the next three years, supported by a broad shift towards easier monetary policy and still‑accommodative fiscal settings. We have raised our global growth assumptions, with the United States (US) expected to grow above capacity, and both Europe and China showing signs of improvement. Inflation is falling across most regions and is assumed to return to central bank targets. Against this backdrop, further interest‑rate cuts are expected from the US Federal Reserve and the Bank of England, while Japan remains an outlier where policy normalisation is ongoing and another rate hike is likely.
Bloomberg consensus (aggregated forecasts from financial analysts, compiled by Bloomberg) anticipates exceptionally strong earnings growth for 2026 across most regions. Our valuation models point to more moderate outcomes, though still supportive of equity markets. US valuations remain elevated as conditions underpinning the secular bull market remain firmly in place, while the valuation gap between the US and both Europe and emerging markets (EMs) narrowed during 2025. On a medium‑term basis, global equities – across all major regions – are rated neutral.
As interest rates move lower, cash becomes less attractive. Government bond yields in most markets are now close to our fair‑value assumptions and are therefore rated neutral. Credit spreads remain historically tight and below fair value, yet the combination of resilient global growth and strong corporate balance sheets continues to provide support. The US dollar weakened through 2025 and, while we continue to view the currency as being in a longer‑term secular bear phase, a near‑term rebound remains possible.
The United Kingdom’s outlook has improved modestly, supported by clearer disinflation trends and expectations of further rate cuts from the Bank of England. Inflation continues to ease towards target, helping stabilise financial conditions and providing some relief to households and businesses. Gilt yields have moved lower as markets price a smoother policy‑easing cycle, while still reflecting pockets of volatility linked to fiscal uncertainty. Credit markets remain well supported, with tight spreads underpinned by solid corporate balance sheets. UK equities continue to screen attractively on valuation grounds, with sentiment improving and earnings expectations firming across several sectors. Medium‑term expected returns for UK assets remain neutral.
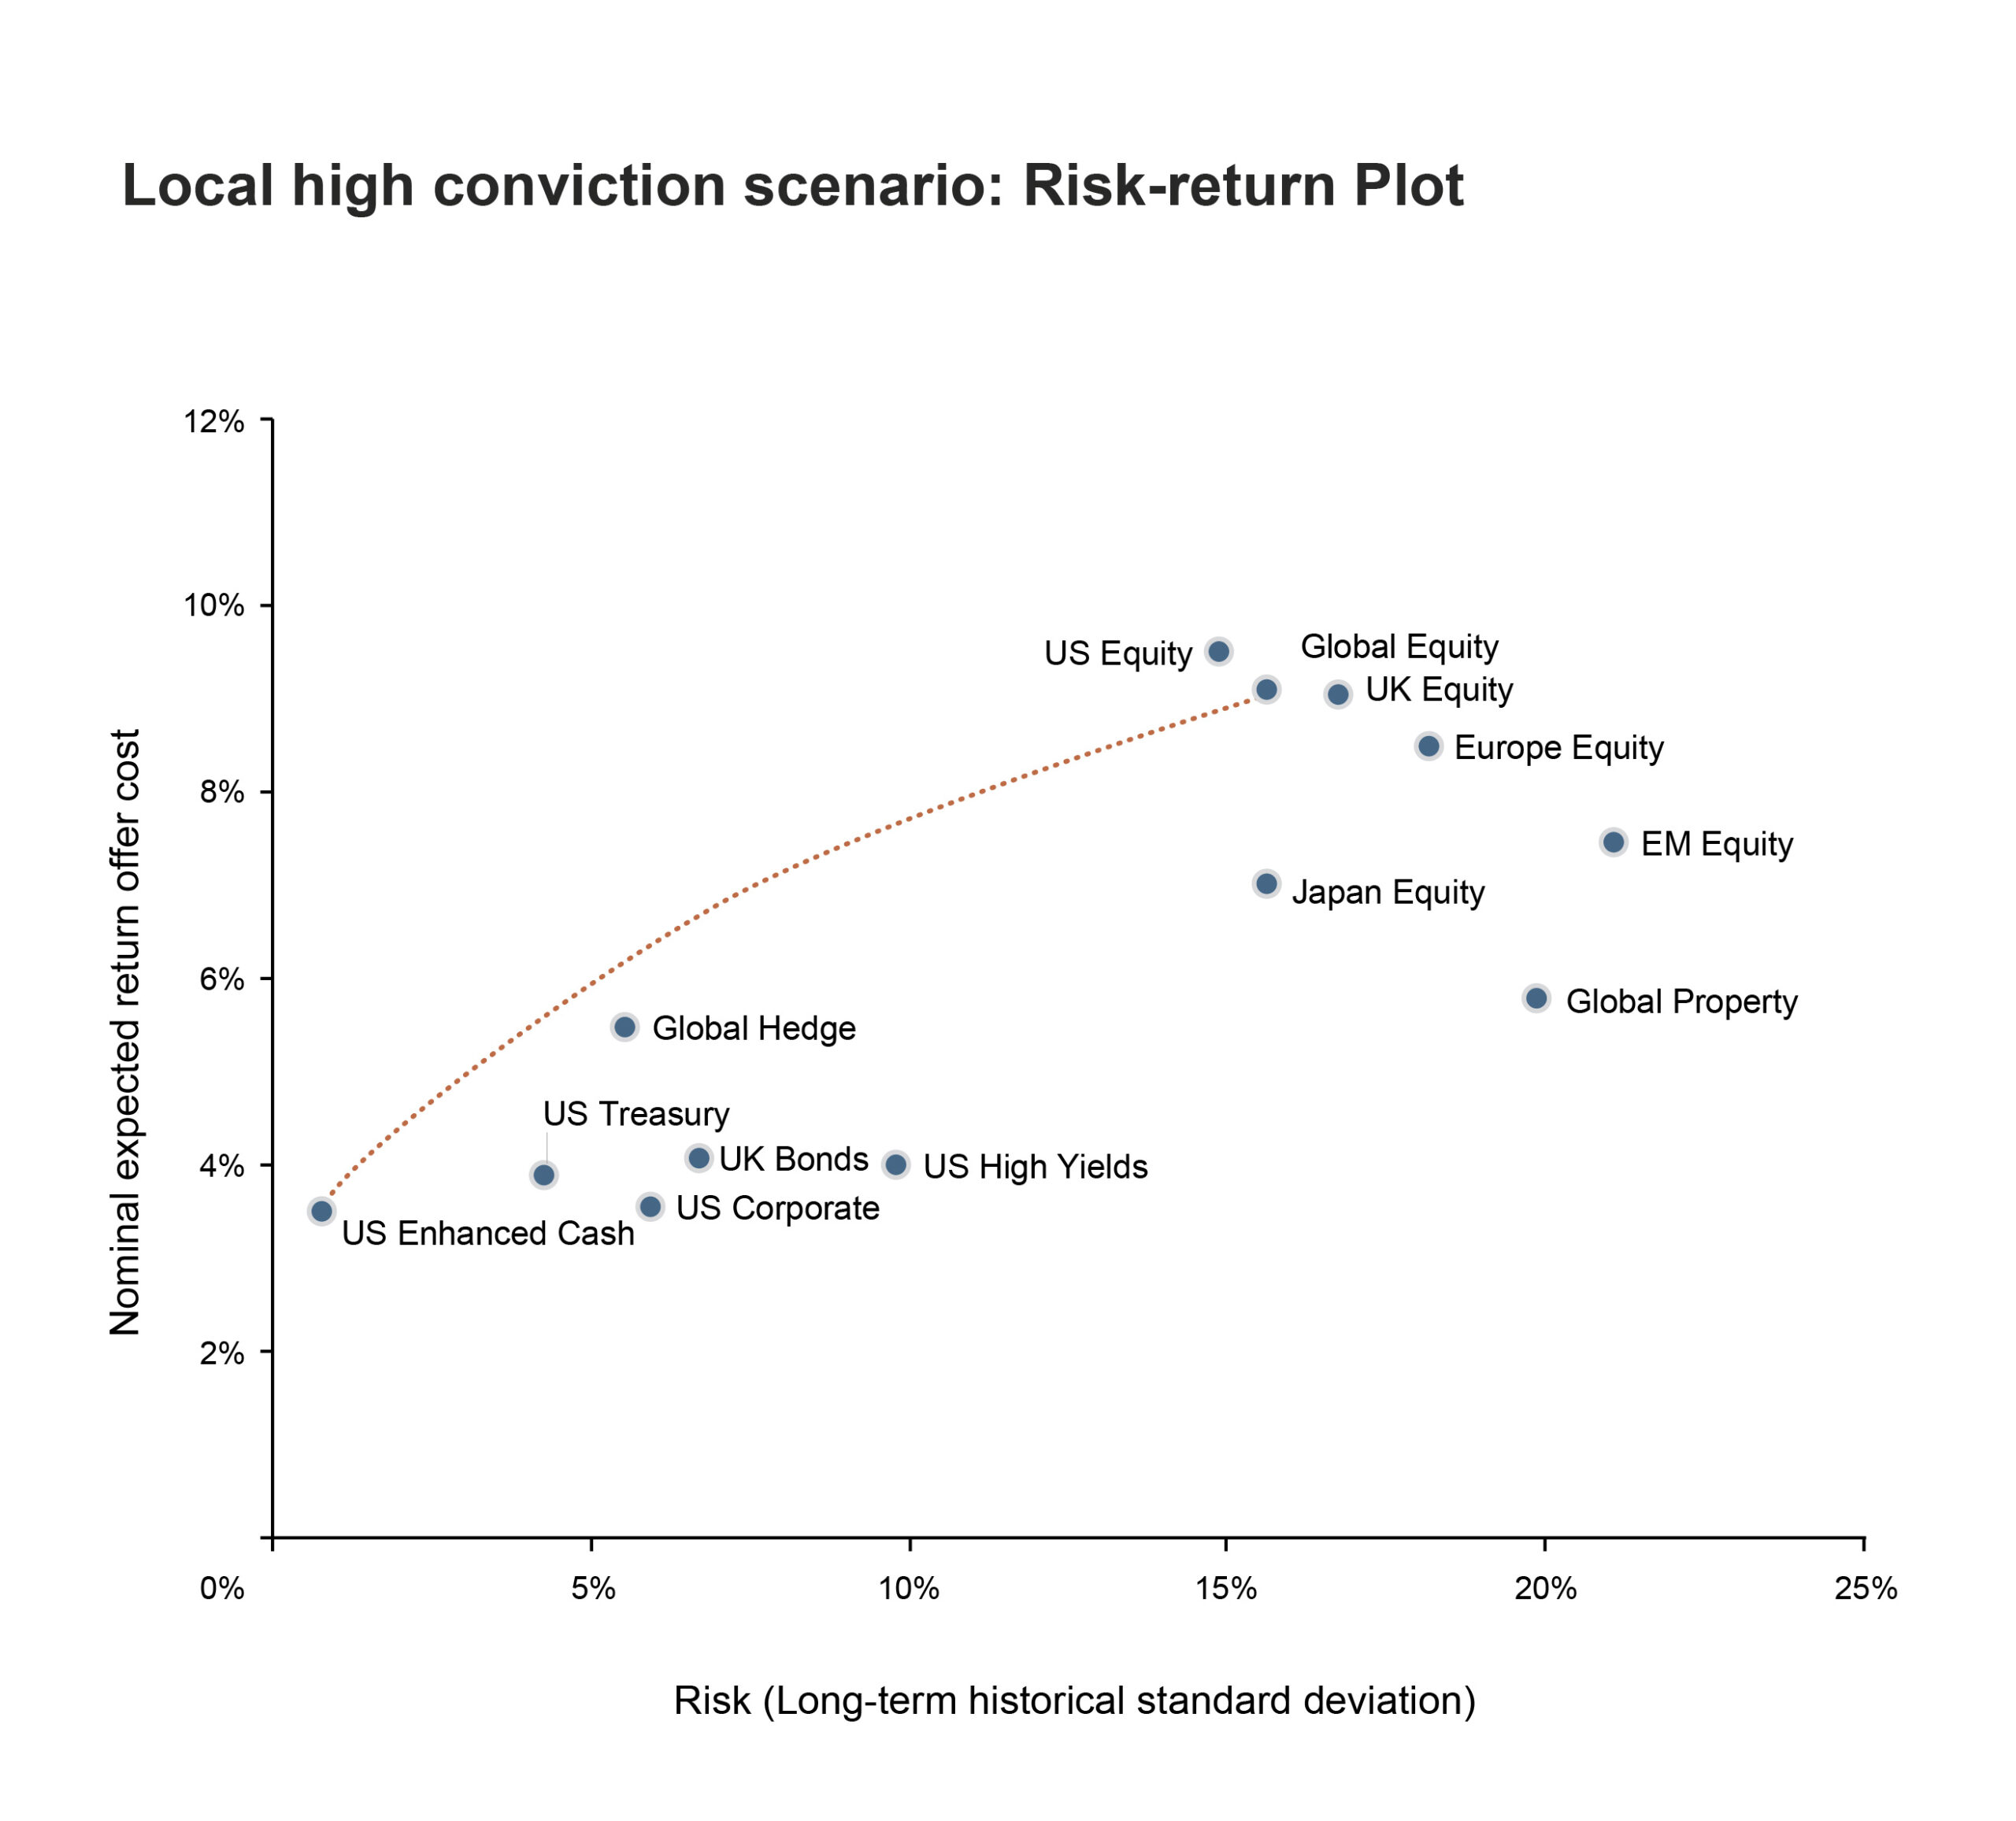
The chart below shows the three-year expected return versus the historical standard deviation of each asset class, based on our High Conviction scenario.
Near-term asset class views
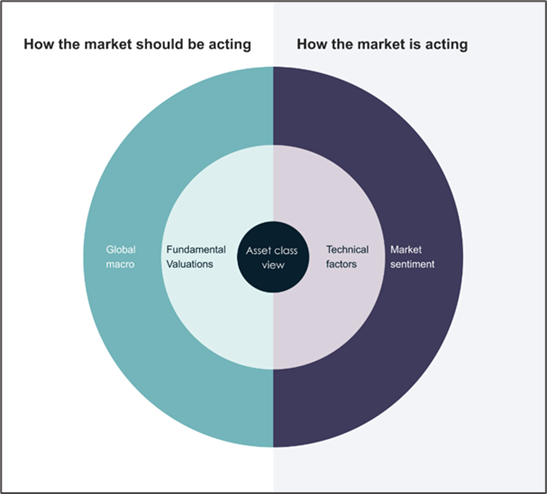
Our investment process is anchored by a High Conviction macroeconomic scenario and the corresponding expected returns for asset classes. This foundation helps us form expectations about how markets should behave. However, we are keenly aware that short-term market behaviour frequently deviates from these expectations. We have long recognised that medium-term, valuation-based signals are often poor guidance for short-term asset performance.
To address this, we’ve developed a range of tools and indicators to enhance our short-term analysis. These include a close examination of market dynamics, cross-asset correlations, and currency and commodity trends, and several other technical factors. These insights help us adapt our views and make more informed short-term decisions.
The diagram below gives a visual representation of how these two parts of the process play into each other.
In addition to our top-down (looking at the broader market) analysis, we integrate the bottom-up (company) insights provided by our analysts. Their detailed research on individual companies and sectors plays a crucial role in shaping our overall views. When bottom-up analysis reveals fundamentals that diverge from market signals – positive or negative – we take this into account in refining our positioning. This dynamic approach allows us to balance macroeconomic factors with granular insights, ensuring our investment decisions reflect both the broader market environment and underlying characteristics of individual assets.
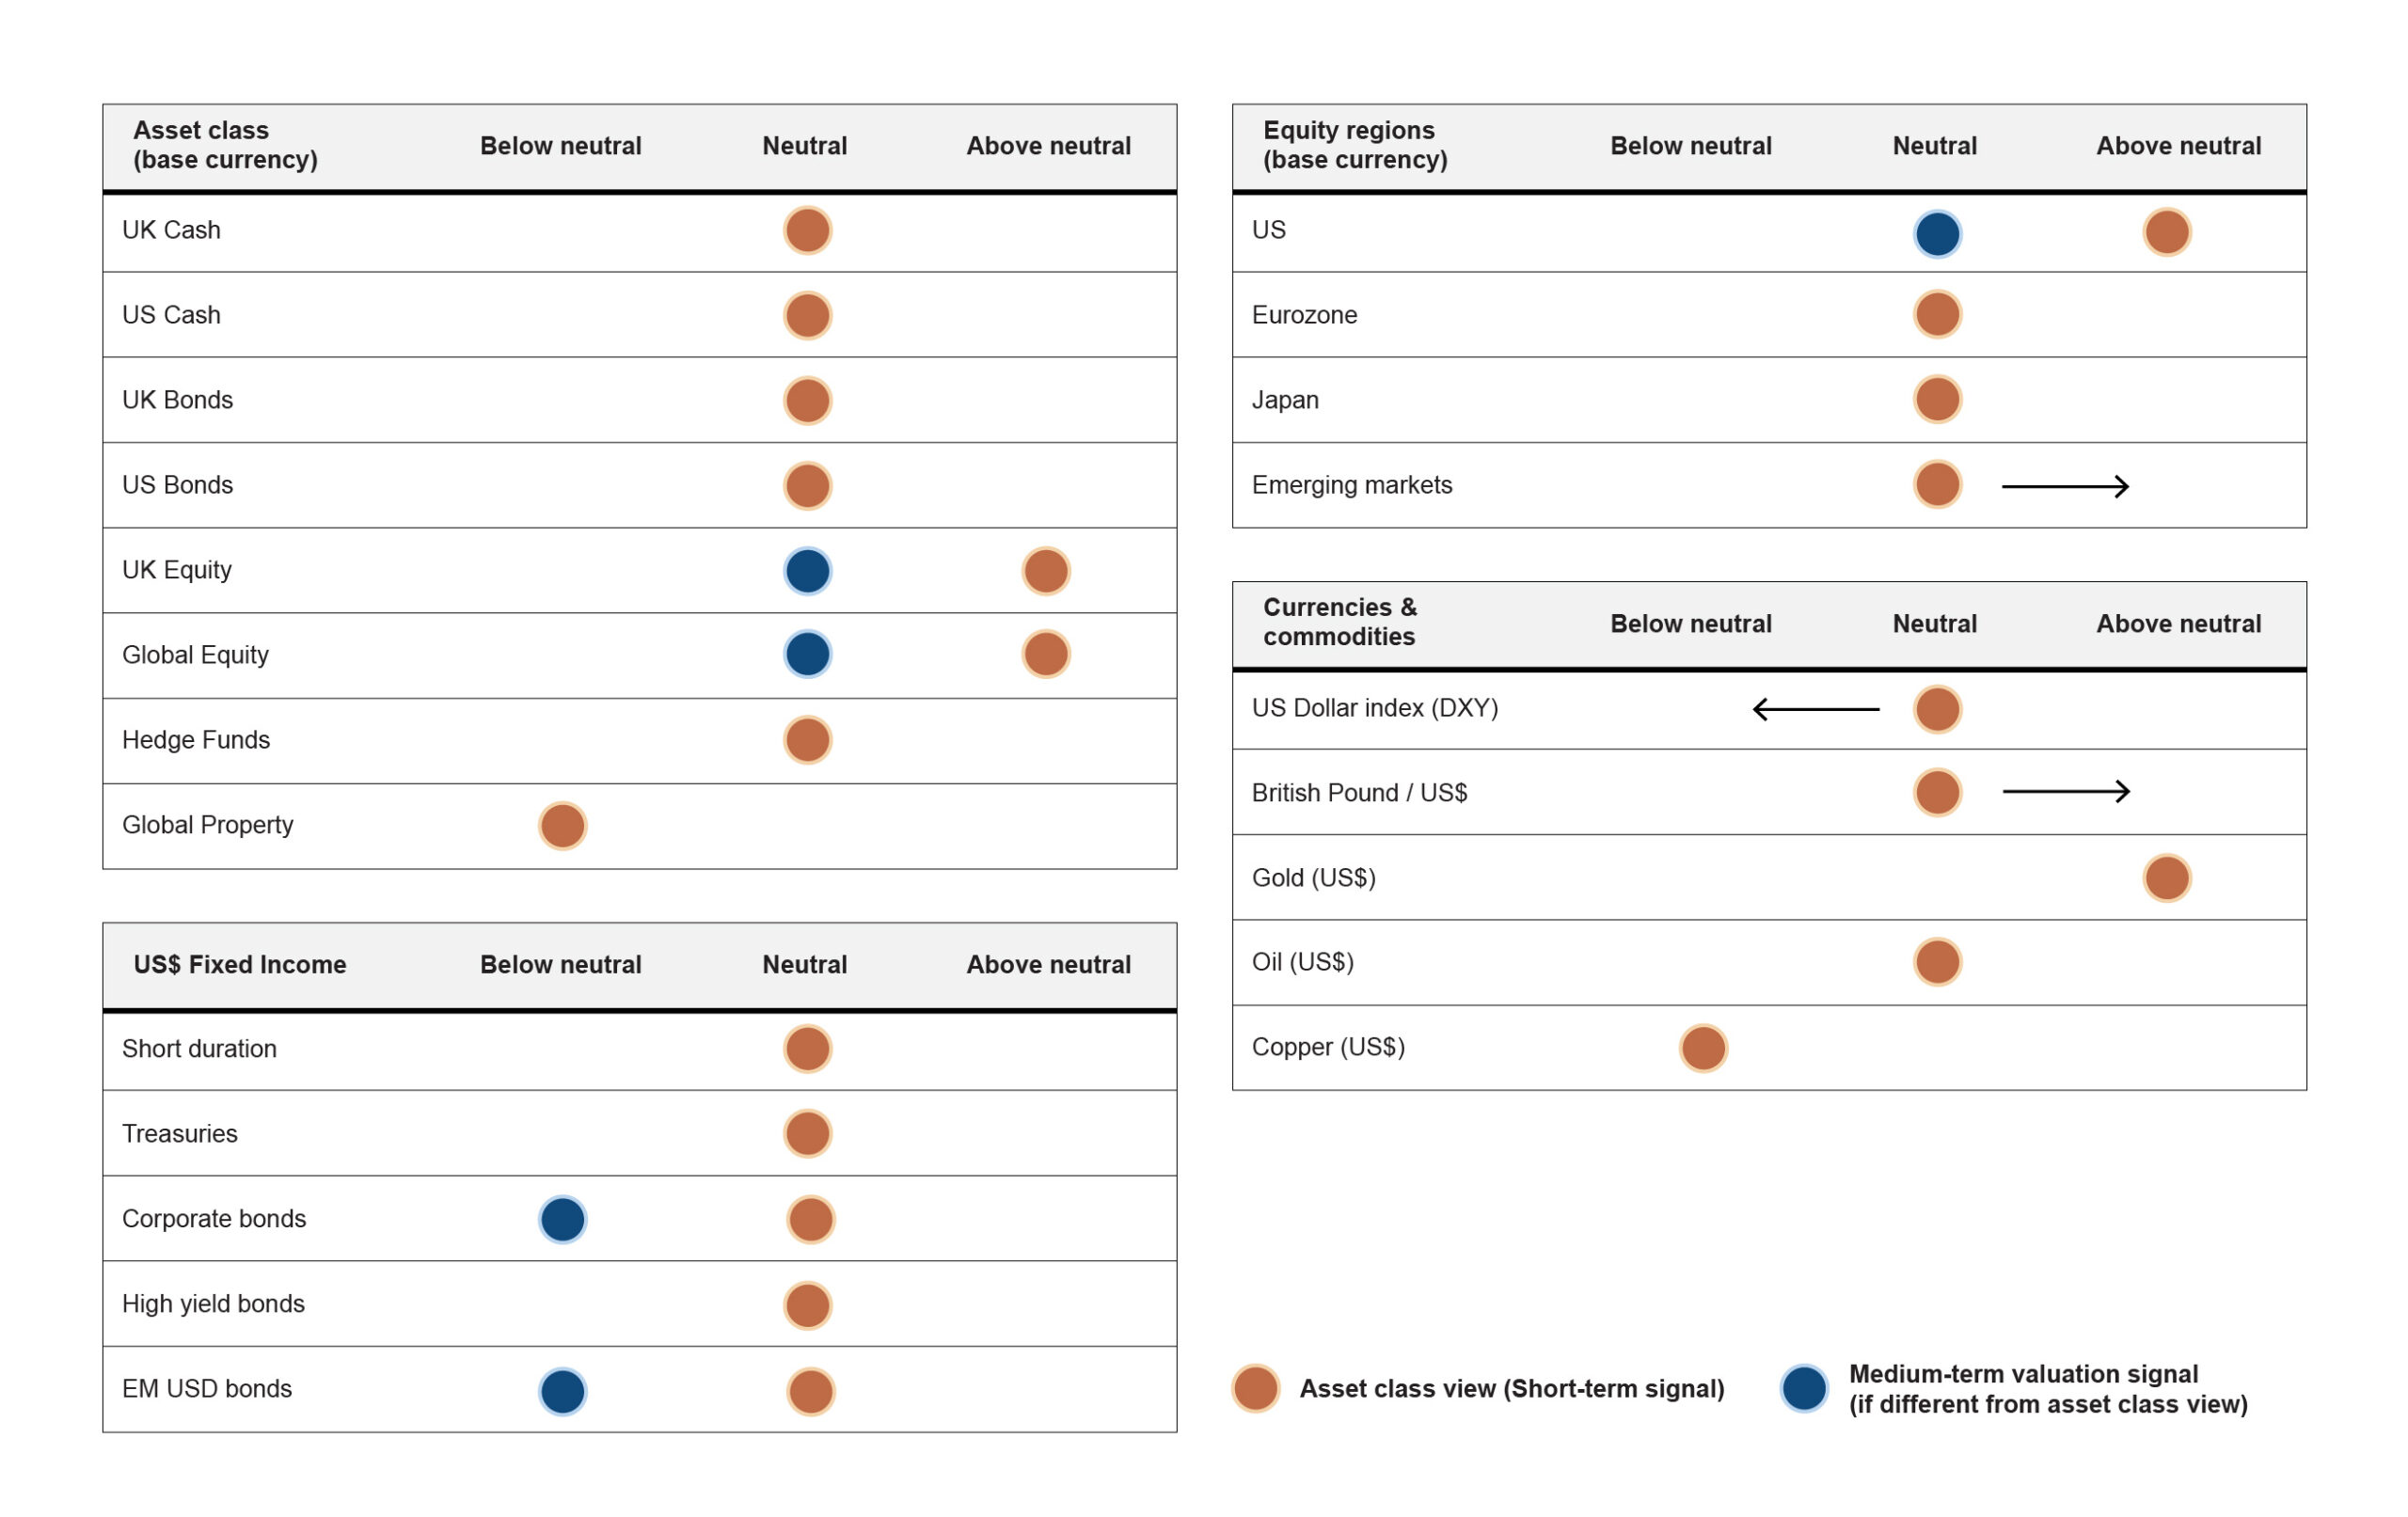
Our latest asset class views are summarised below. The orange blocks represent the short-term views from the team, sometimes with an additional arrow if a Neutral view has more up or downside potential. Where the High Conviction scenario medium-term signals are different from the short-term views, it is indicated in blue. To determine the signal as Neutral or Above and Below, the model compares expected returns to what investors have historically required from these asset classes. For example, a Neutral Outlook implies a real expected return range of -0.5% to 1.5% for US Cash, 0.5% to 3.5% for US Bonds, and 3.5% to 8.5% for Global Equity. Views are expressed in the base currency of each asset class; currencies views are expressed separately.